

England's All-Cause Mortality Data by Vaccination Status
England's All-Cause Mortality Data by Vaccination Status
A brief analysis of the updated ONS English All-Cause Mortality Data by vaccination status.

Today the British, ONS, has updated their dataset called ‘Deaths by vaccination status, England’. It was long awaited, because all-cause mortality data by vaccination status is seen by many as a more reliable measure of overall vaccination effectiveness, because the COVID-19 metric might have several problems.
Upon writing this article, it came to my attention that the data has completely changed! This is likely due to the criticism, expressed by many, including Fenton et al, to the ONS directly, in which they responded recently, and confirmed the suspected problems.
Same chart, based on the previous May 2022 release (left) and the current Dec 2022 (right):
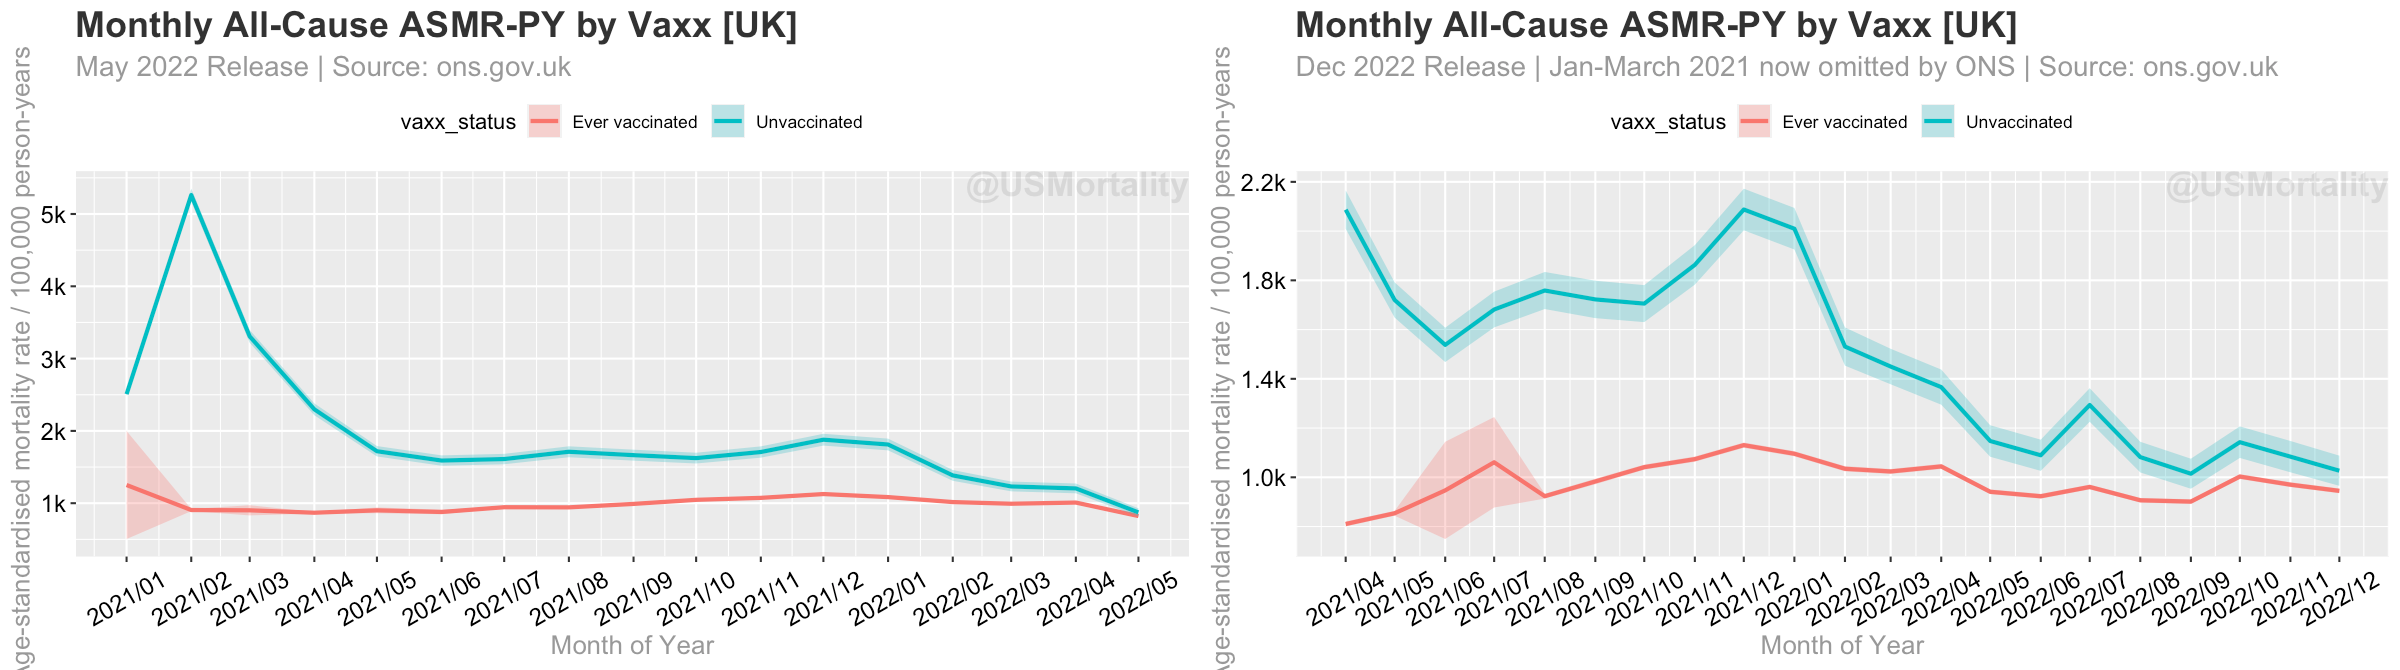
As you can see, the rates have changed significantly, and ONS omitted the problematic Jan-March 2021 data completely, therefore, indirectly confirming the theory of Fenton et al., that the ‘spike’ was caused by a delay in vaccination record reporting. Hence, beware of these misleading combined charts, so that it appears worse for the unvaccinated:


Back to the topic - ONS provides an Excel file with 5 sheets, that contain mortality rates by age and sex and deaths, each by vaccination status.
Age-Standardized Mortality Rates
The first sheet of the ONS publication covers age-standardized mortality rates (ASMR), divided by person years (PY), and by vaccination status.
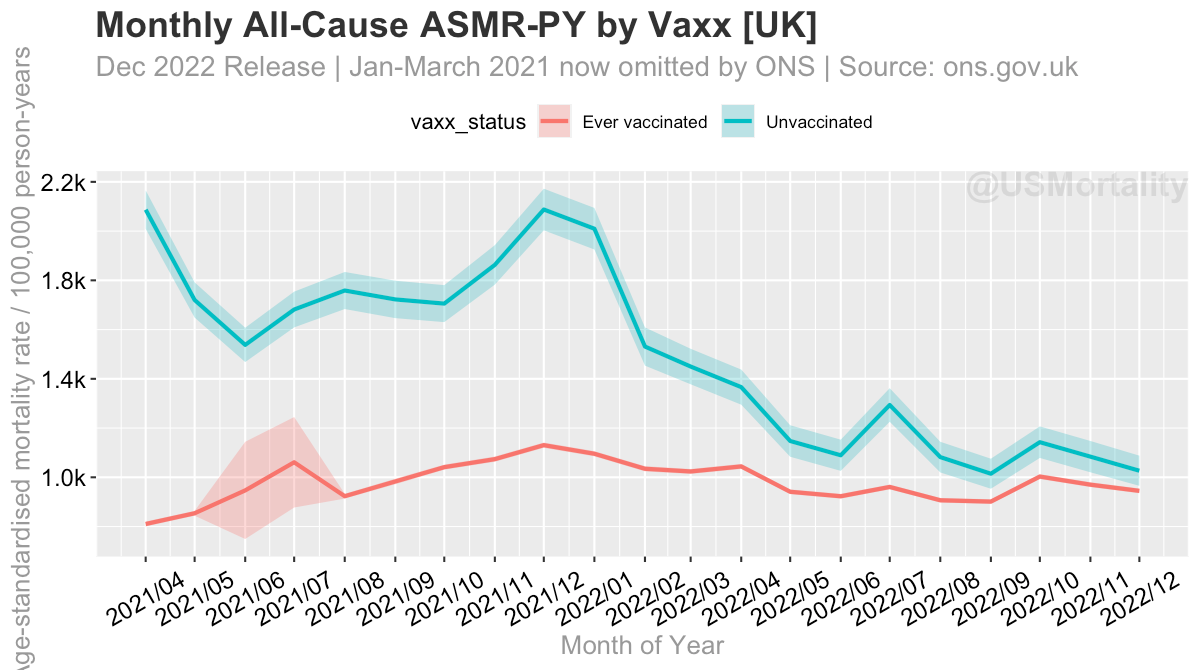
So charting the ‘ever vaccinated’ vs the ‘never vaccinated’ reveals this chart (same chart as above, just notice the y-axis)
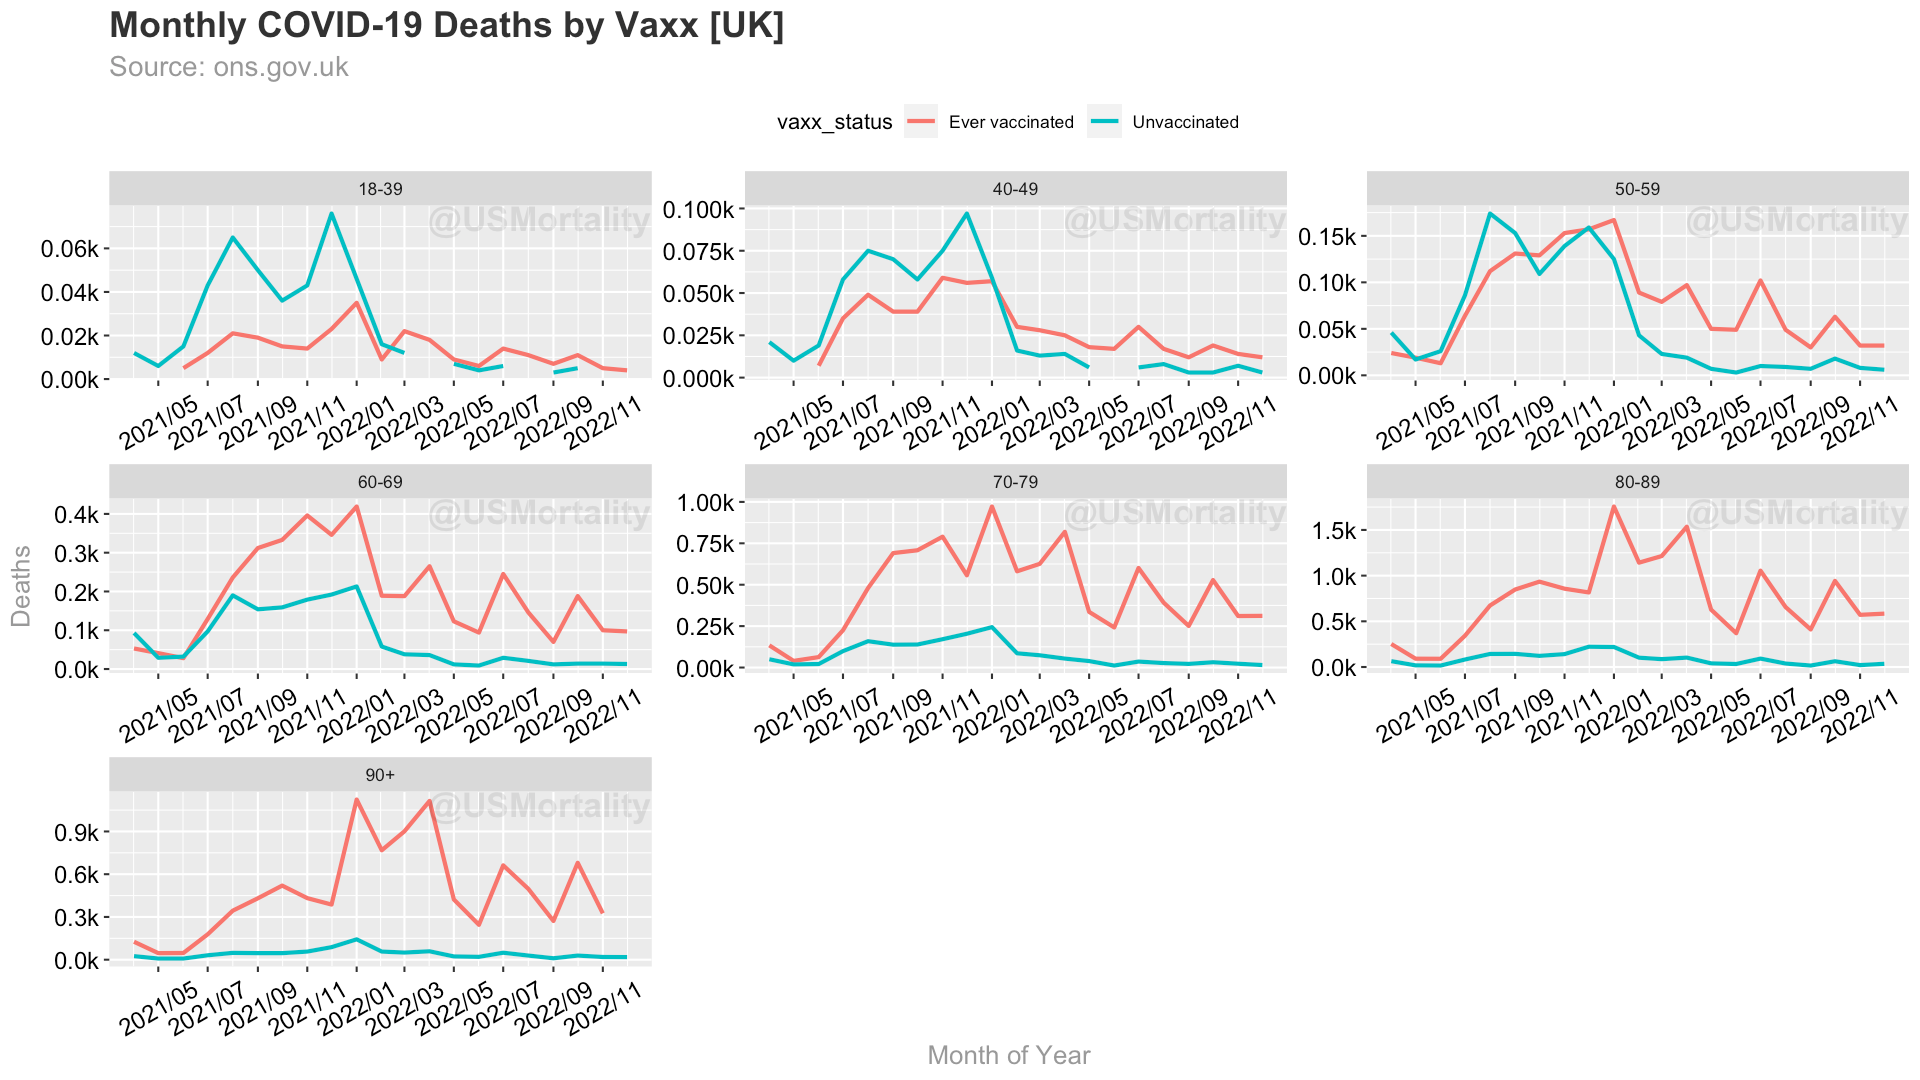
Looking at only the COVID-19 death rates, by vaxx status, reveals a similar picture:

However, it has been previously pointed out by Fenton et al., that there are several issues with this chart and the underlying data.
First, the all-cause mortality rates without COVID-19, would be expected to similar, or at least constant over time, but they are not:
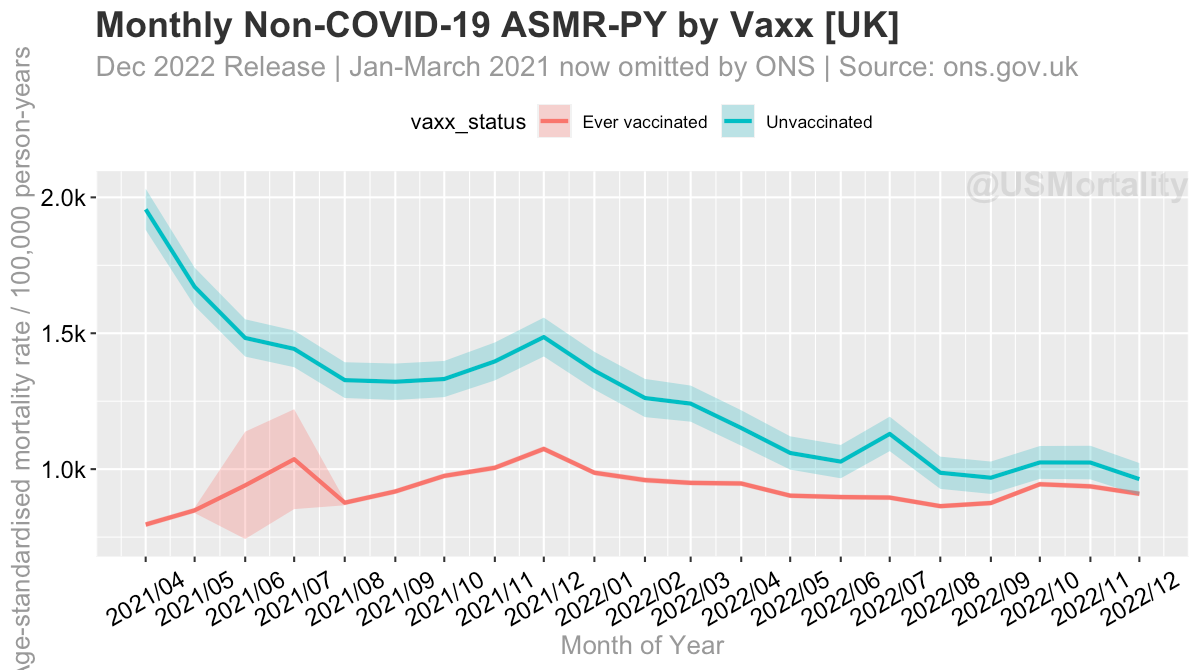
This suggests, that there are likely some major confounders in the data, or methodological errors…
An experiment to correct the bias…
We could try to ‘adjust’ the first chart by calculating a correction factor, for the weekly difference between the vaccinated and unvaccinated non-covid mortality rates.
So if we calculate a correction factor, and divide the unvaccinated rate, by the correction factor, we get an approximation of what could be closer to reality:

As it can be seen, the rates are non-statistical significant except for the period between 2021/8 - 2022/3.
Another approach to adjust this data, is by simply downshifting the unvaccinated by the difference in proportional COVID-19 deaths, as shown here:


Actual deaths
These above rates, suggest, that it’s mostly the unvaccinated that are dying. In absolute terms this is false, as one can see, by simply looking at the raw deaths. The vast majority of the all-cause deaths are actually vaccinated. Now that is obviously the majority of people are vaccinated, but it means, that comparing the two groups is problematic, because they might be vastly different, in other factors, such as overall healthiness.
All-Cause

Non COVID-19

COVID-19
Mortality Rates by Age and Vaccination Status
Let’s have a look at the individual age groups mortality rates (MR).
Noteworthy, that ONS, has omitted the rows for ‘Ever vaccinated’. It is unclear why, but it does not increase trust, as we can suspect, that these rates might not be favorable for the vaccinated. So in the following charts, we can only compare the individual vaccination categories, and not a blended rate.
It is very interesting, that the provided confidence intervals appear to vastly overlap, which means that there’s no statistical significant effect. We can see, though, that first dose vaccinated typically even has the highest mortality rate.
All-Cause
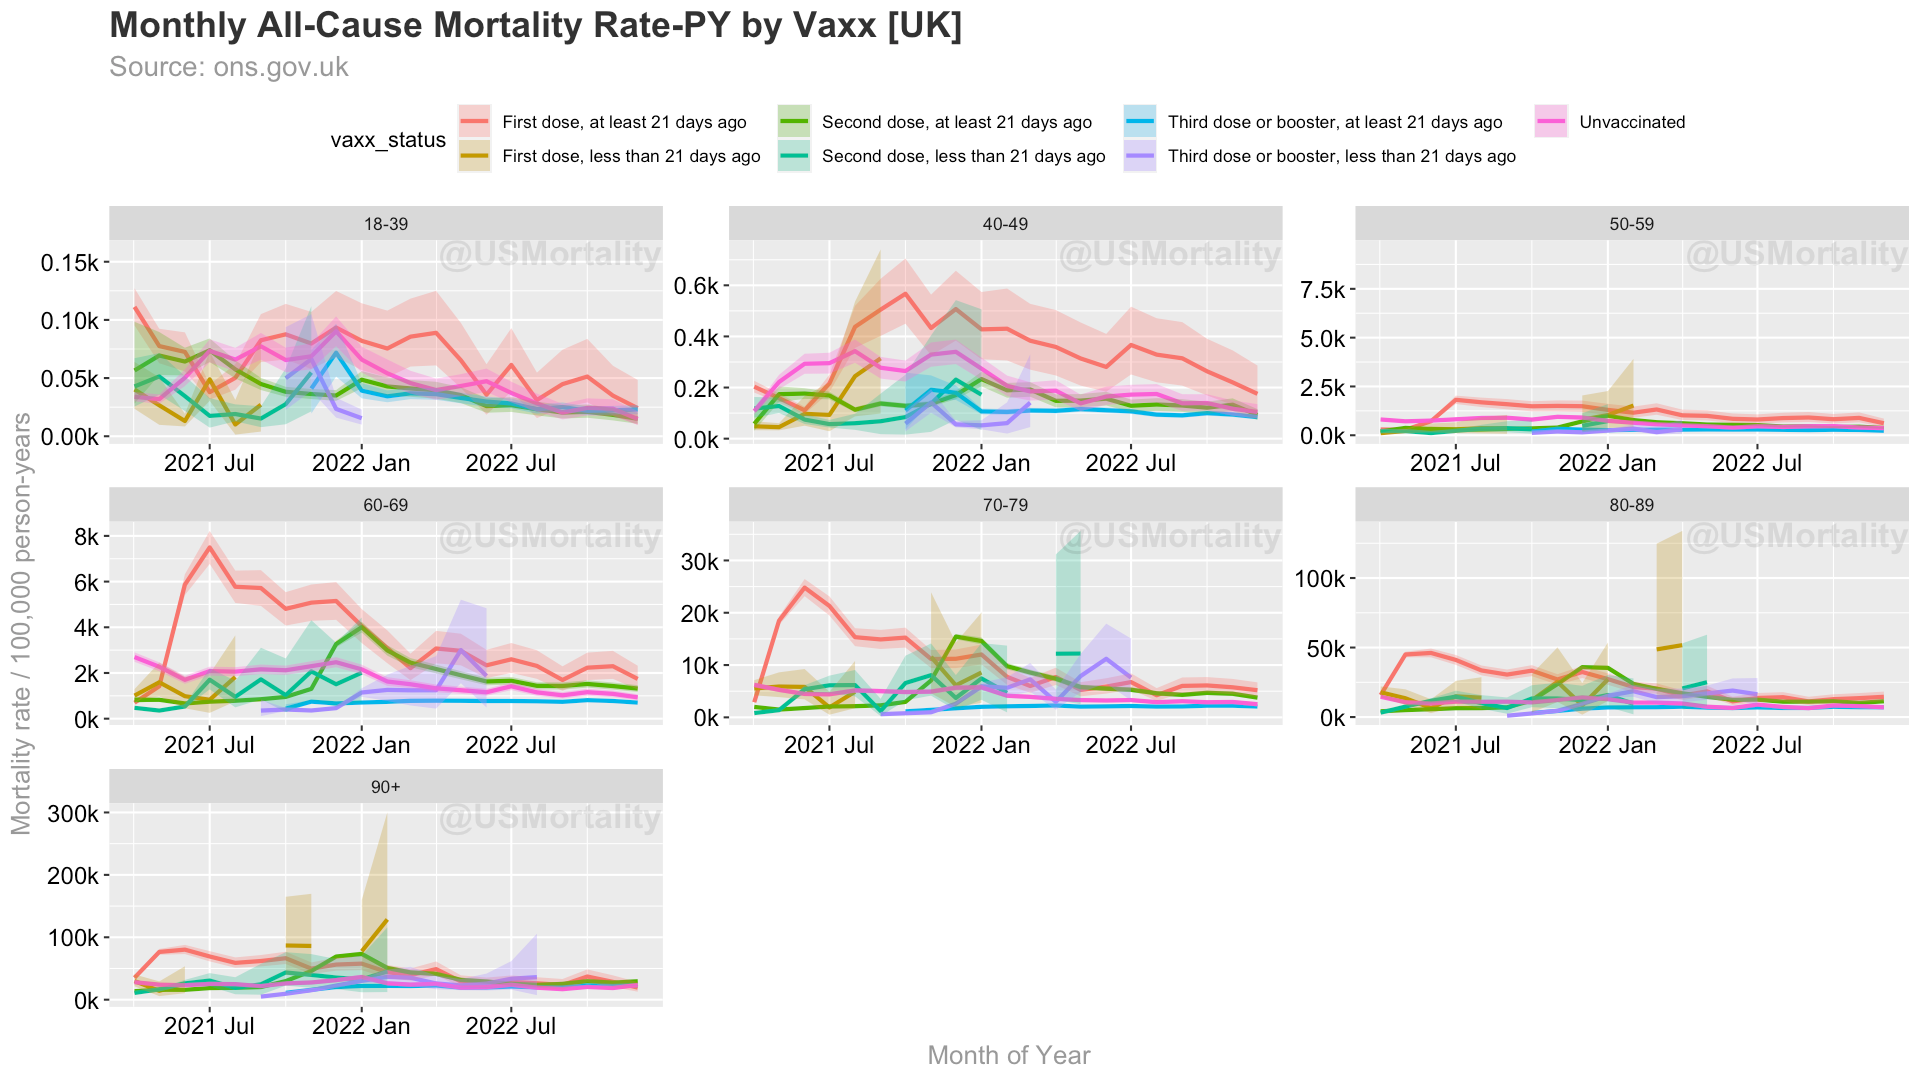
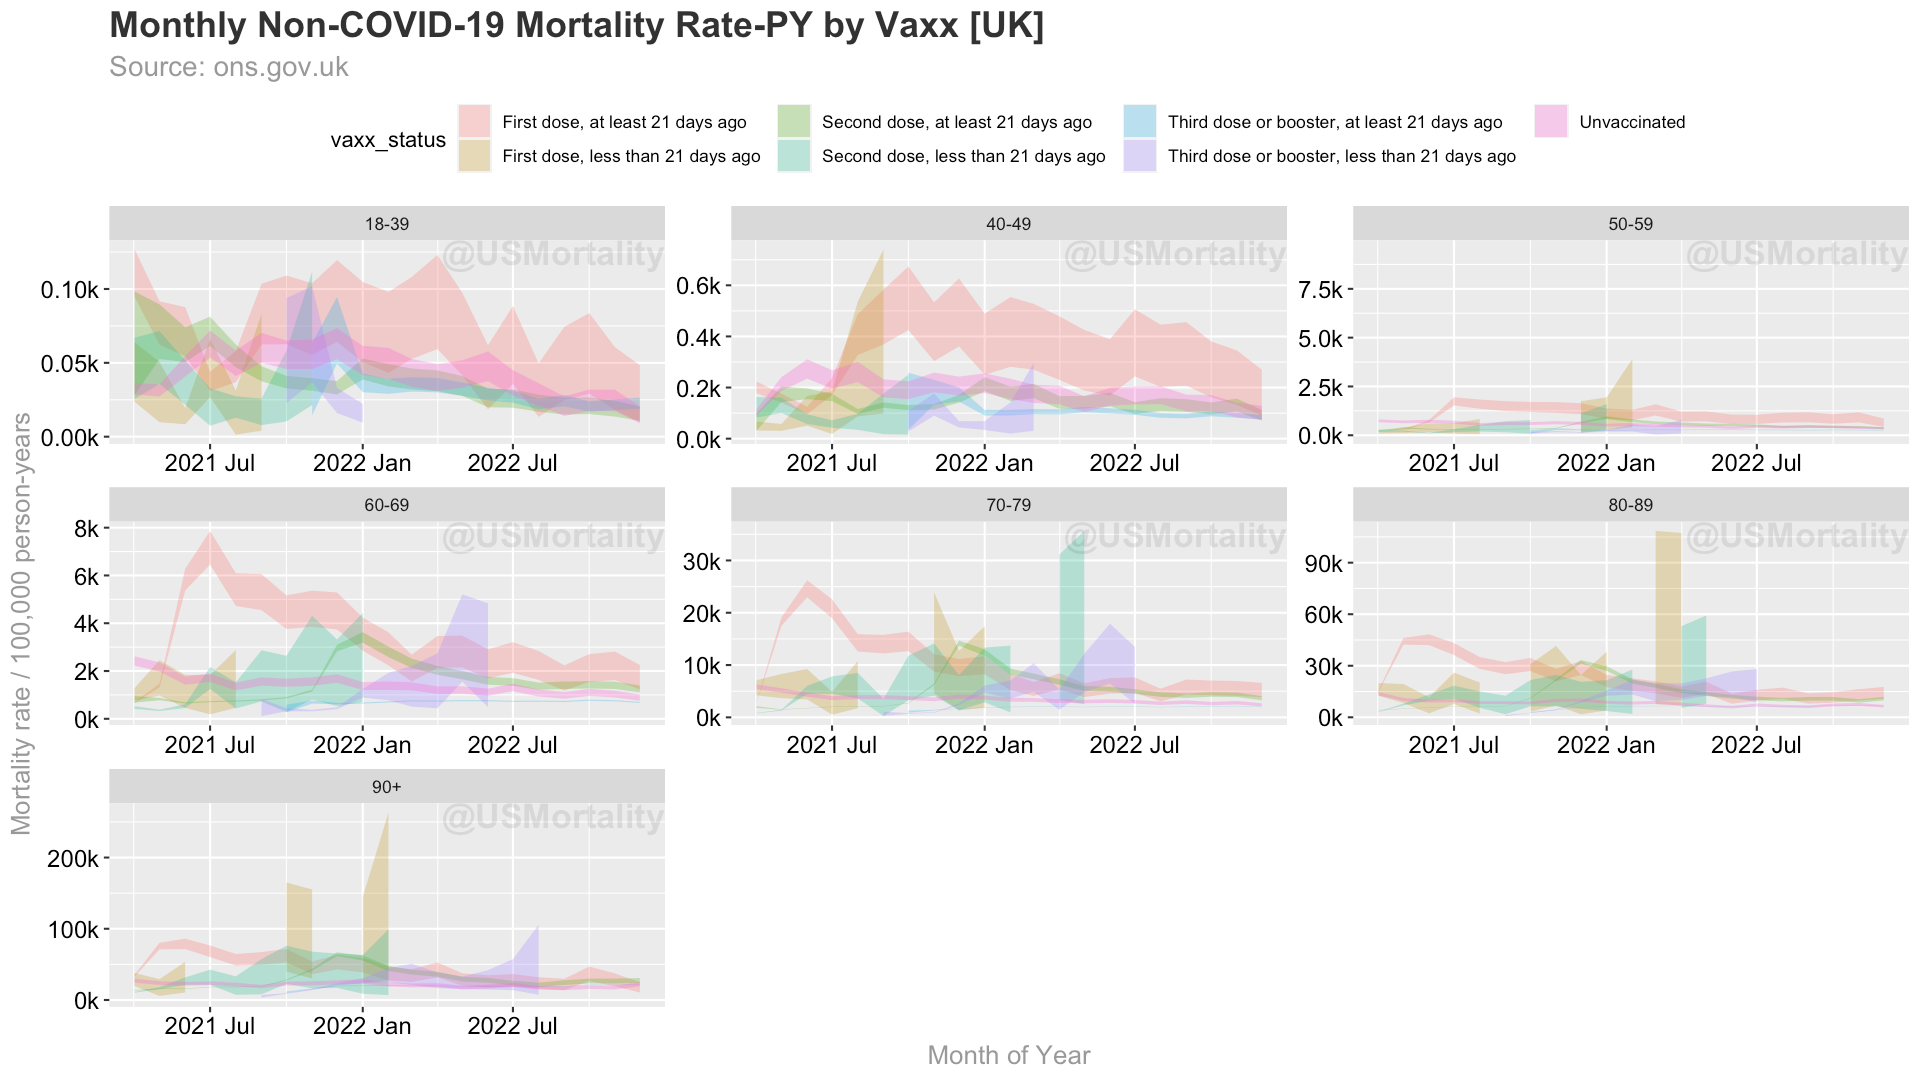
Same chart, only with the confidence intervals:

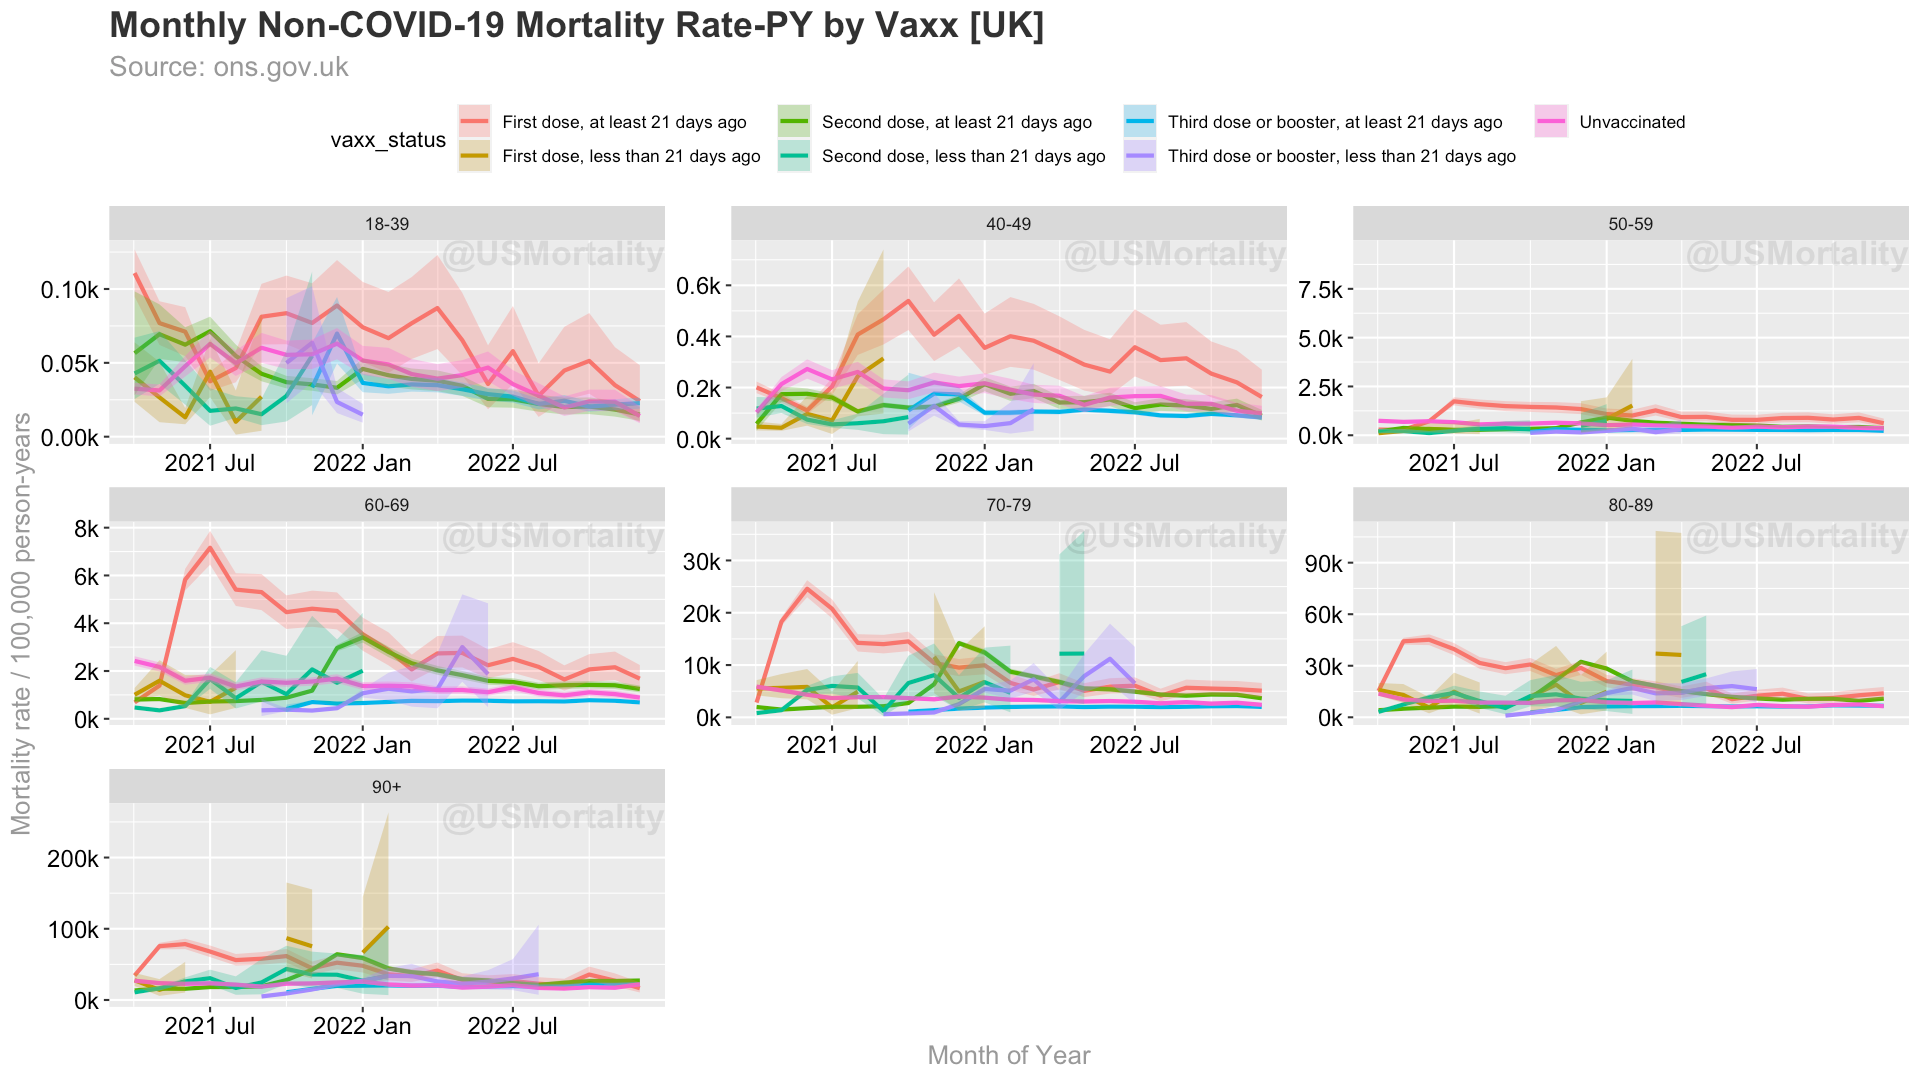
Non-COVID-19
COVID-19
Here the unvaccinated mostly have a higher mortality rate, but for example in the 60-69 age group, ‘1st dose >21d’ and ‘unvaccinated’ are comparable, which suggests that there’s no vaccine efficacy, as already 1 dose according to the ‘FDA Briefing Document Pfizer-BioNTech COVID-19 Vaccine’ document, was claimed to be 89% effective (page 31).

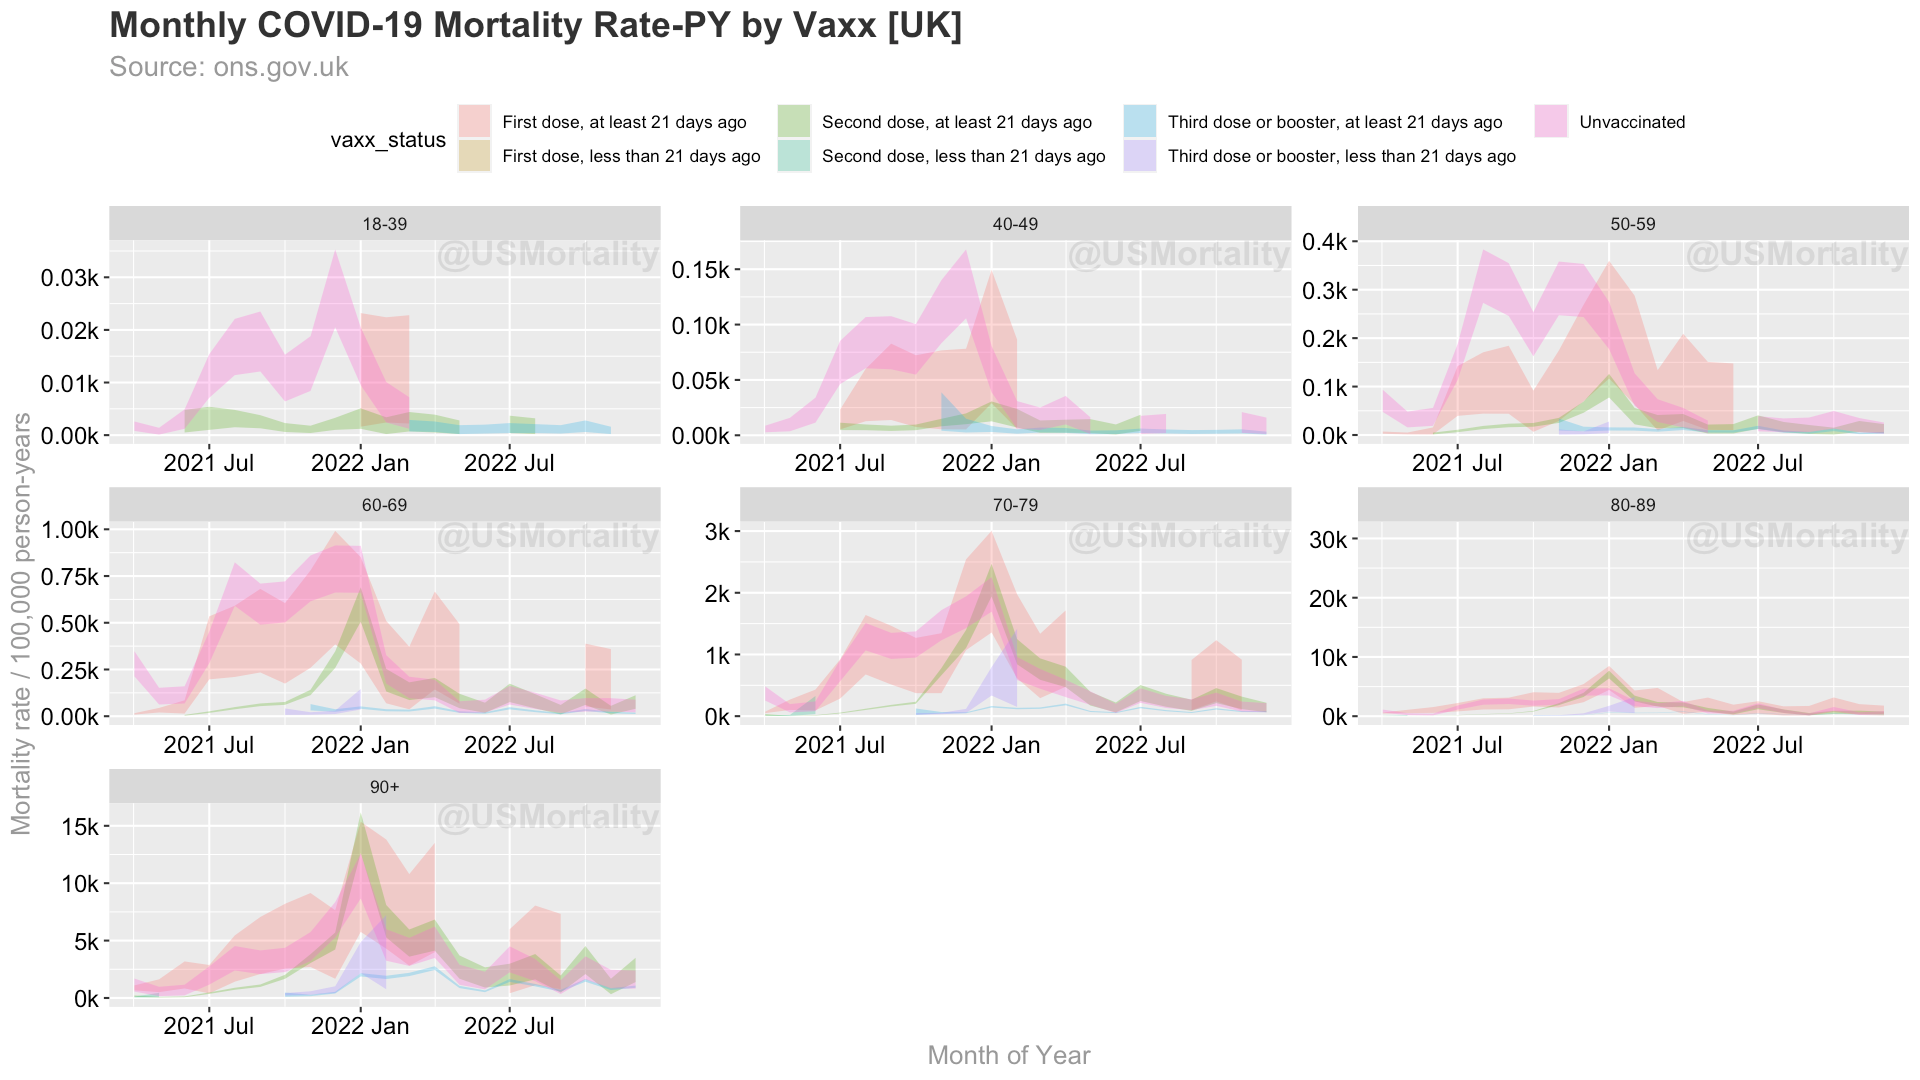
In reality, no conclusion can be drawn from these charts, the data is simply too noisy. A blended vaccination rate for ‘Ever vaccinated’ would be helpful here, but ONS has omitted them, as mentioned above. A significant positive vaccine effect can not be seen, either, instead the mortality rates for all groups decline and strive towards lower/normal levels, as to be expected with an ending epidemic.
COVID-19 Vaccination Status attribution
It’s unclear, wheter the ‘unvaccinated’ column truly contains people that were never vaccinated. Sarah Caul, who works at ONS has confirmed today, that people with ‘unknown vaccination’ status were lumped into the ‘unvaccinated category’:

Comparing to All-Cause Mortality Excess
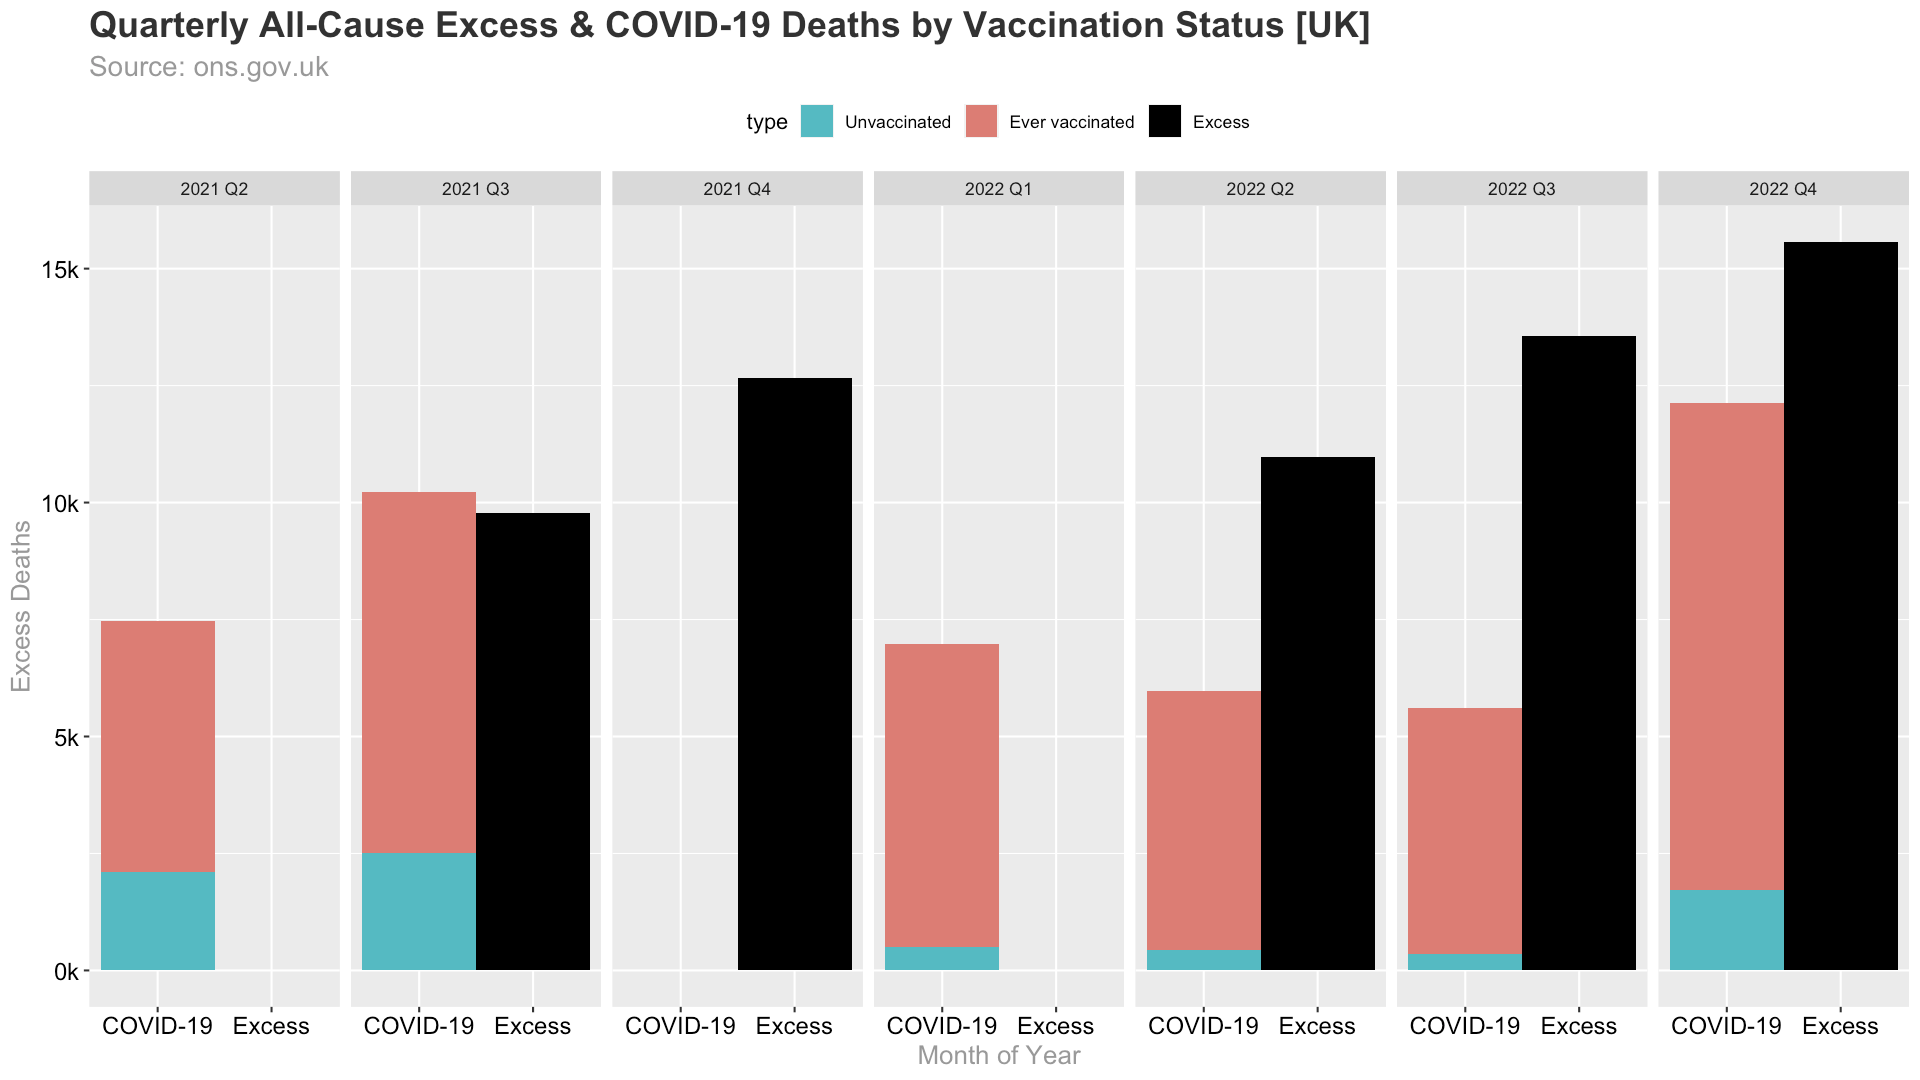
Lastly, let’s look at all-cause excess deaths, and compare them to the COVID-19 deaths by vaccination status.
For this I have taken the monthly reported deaths, and compared them to the 5y baseline, that is provided in this ONS dataset.
Excess vs COVID-19 (Vaccinated & Unvaccinated)
The COVID-19 deaths, both vaccinated & unvaccinated, make up the majority of excess deaths, but do not account for all the excess mortality over the last month.
The COVID-19 vaccinated deaths, make up a large part of the excess deaths. In contrast, unvaccinated COVID-19 deaths, are not really significant compared to the other excess deaths. 2021 Q2 & 2022 Q1 had a mortality deficit. 2021 Q4 Covid-19 deaths are missing (see next chapter).
UPDATE, ONS has just corrected the error (1/22/2023), now the chart looks like this. (See here for details)

Missing 2021 Q4 COVID-19 data
You might notice the missing bar for 2021 Q4. There appears to be some underlying issues in the dataset of Table 5, as you can see from the screenshot, there’s a sudden jump in the dates. Hence, the data for ‘Deaths involving COVID-19’ for Oct, Nov & Dec 2021 are missing.


I will inform the ONS, about the missing data (‘Ever vaccinated’ by age & ‘Deaths involving COVID-19’)
Summary
There are significant changes from the last dataset, made by ONS, which raise questions to the reliability of the used methods (denominator), as described by Fenton et al.
Severe confounding is likely still present in the data, as shown by the significantly higher non-Covid19 mortality (‘healthy user bias’ of the vaccinated).
In absolute terms, vaccinated deaths are the majority.
No clear vaccination effect can be concluded, due to confounding and problems with the denominator.
Non COVID-19 excess mortality appears to be on the rise, if this is due to (intentional or unintentional) underreporting of vaccinated COVID-19 deaths, or due to side effect of the vaccines, or other reasons remains to be studied.
There’s still missing and/or hidden data.
Sources & Calculations
All calculations are done in the R language and are available open source here.
Also check out my follow up article on Vaccine Efficacy: https://usmortality.substack.com/p/covid-19-vaccine-efficacy-against
Since the ONS released the previous version of their dataset last summer, I've been thinking that the reason why the ONS stopped releasing new versions of their data may have been that in the previous release, the trend seemed to be that the unvaccinated all-cause ASMR was soon going to dip below the ever-vaccinated ASMR. In the previous release in May 2022, the unvaccinated ASMR was only about 6% higher than the ever-vaccinated ASMR (872.9/822.6), but for some reason in the current release, the unvaccinated ASMR in May 2022 is now about 22% higher than the vaccinated ASMR (1147.5/941.2): https://i.ibb.co/znpDbyK/ons-current-vs-previous-release.png / R script: https://pastebin.com/raw/MqaeLpsN. I don't think the change from the 2011 census to the 2021 census would explain such a drastic difference.
From August 2021 until April 2022, the ever-vaccinated all-cause ASMR in the current version is mostly unchanged from the previous version. However the unvaccinated all-cause ASMR has been shifted considerably upwards especially starting from November 2021.
I think in the previous version, the huge spike in unvaccinated all-cause ASMR around February 2021 was because they classified people as unvaccinated for two weeks after their first jab. There was a similar huge spike among single-jabbed people in summer 2021 when the second jab was rolled out and among double-jabbed people in winter 2021-2022 when the third jab was rolled out: https://i.ibb.co/D7tbXYg/ons-all-cause-asmr-previous-version.png / R script: https://pastebin.com/raw/8aAK1Gip. The spikes came earlier in older age groups which received the second and third shots earlier.
BTW the new version has multiple errors in tables 3, 4, and 5:
- In tables 3 and 4, the data for female all-cause mortality ranges from April 2021 to December 2021, but the data for male all-cause mortality, male and female COVID mortality, and male and female non-COVID mortality all range from January 2021 to September 2021.
- If for example you look at the number of all-cause deaths in the unvaccinated group in table 3, the sum of females in April 2021 (1753) and males in January 2021 (1803) adds up to the total number of deaths of both sexes in April 2021 in table 1 (3556). And similarly if you look at all-cause deaths in the unvaccinated group in table 3, the female person-years in April 2021 (830492) and male person-years in January 2021 (796882) add up to the total person-years in April 2021 in table 1 (1627374). The data for males is similarly shifted three months backwards for other months.
- Also in table 5, all-cause mortality is listed from April 2021 to December 2022, but deaths involving COVID are listed from January 2021 to September 2022.